All 11 missions
Mission 9. Power Planner
Energy PlannerNumber60 min
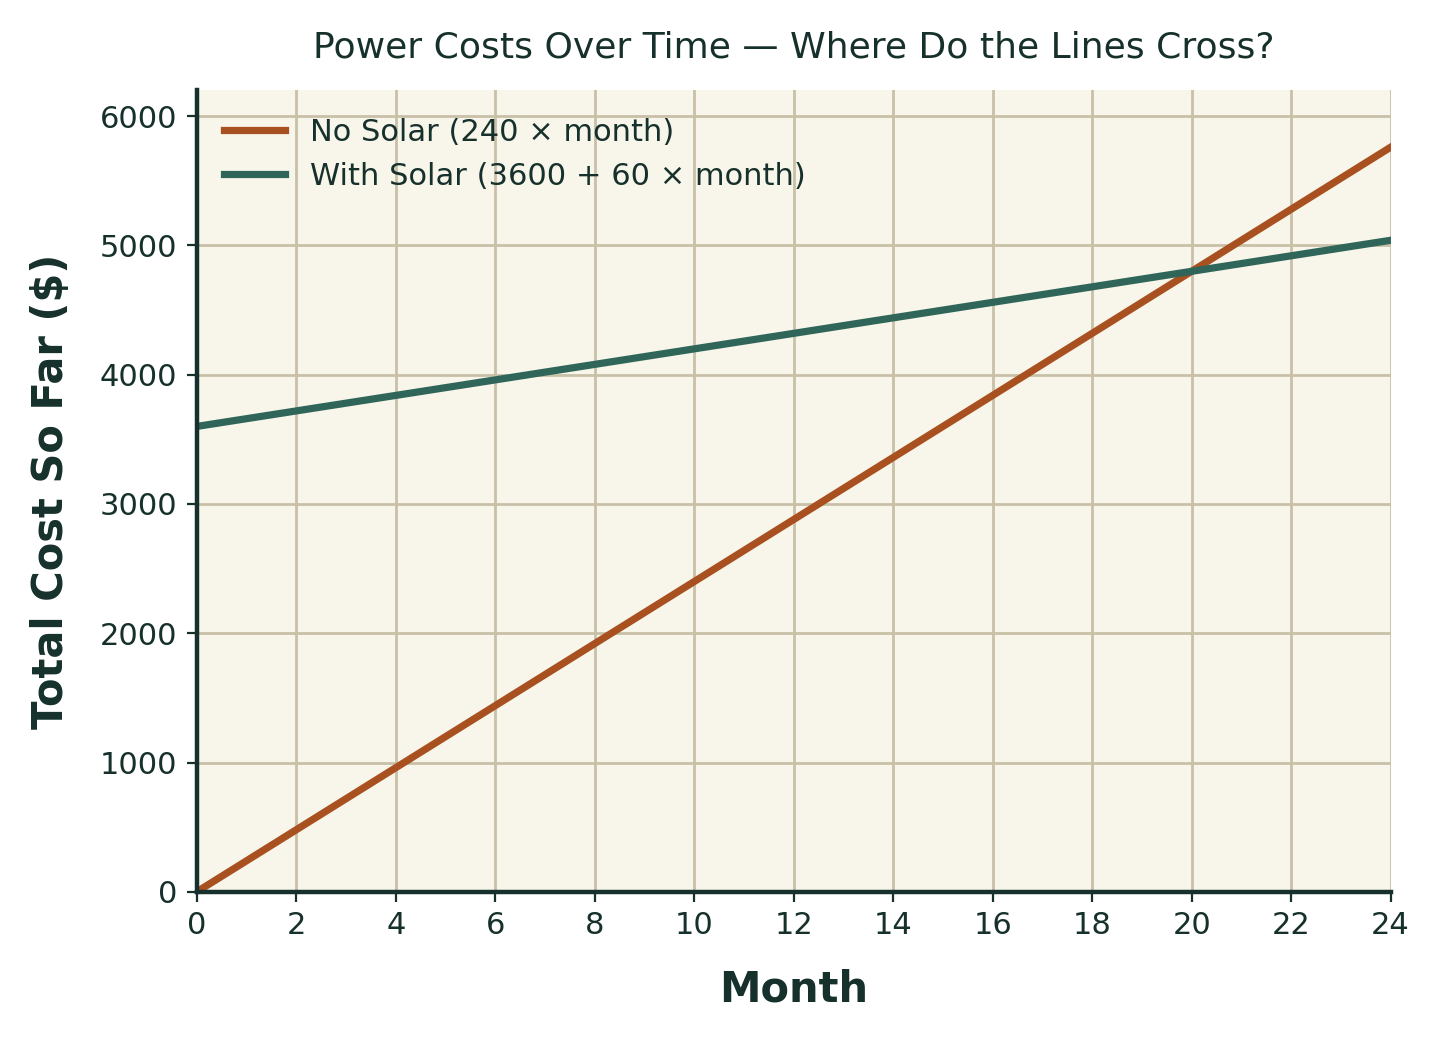
The school hall has a high power bill. You've been asked to investigate whether installing solar panels would actually save money over time, and if so, how long it would take to pay off.
We are learning to
- Calculate a percentage saving between two costs.
- Read and plot a point on a graph using a month number and a total cost.
- Use a graph to find the point where one option becomes cheaper than the other.
Success criteria, I can
- I can calculate a monthly saving and express it as a percentage.
- I can explain what a point like (0, 3600) means on this graph.
- I can read a break-even point from a graph and check it using multiplication.
From the worksheet
Adapting this mission to your community
- Replace the school hall with a real local building (a classroom block, clinic, or community hall) and use real or realistic bill figures if available.
- If solar isn't the relevant technology locally (e.g. diesel generators are the real issue), swap in the locally relevant energy comparison.
- Invite the school's Maintenance staff or a local energy project officer to discuss a real project, if one exists.
Before you teach this
This mission uses a placeholder context. Please localise names, places, and any cultural knowledge in consultation with local Traditional Owners, Elders, or community members, and only include specific cultural knowledge that has been given permission to share.
Download this mission
The PDF is what you print. The Word file is what you edit, so you can swap in a local species, a local seasonal calendar, or local place names before the lesson.