All 11 missions
Mission 10. Training Day Attendance
Team Wellbeing OfficerStatistics60 min
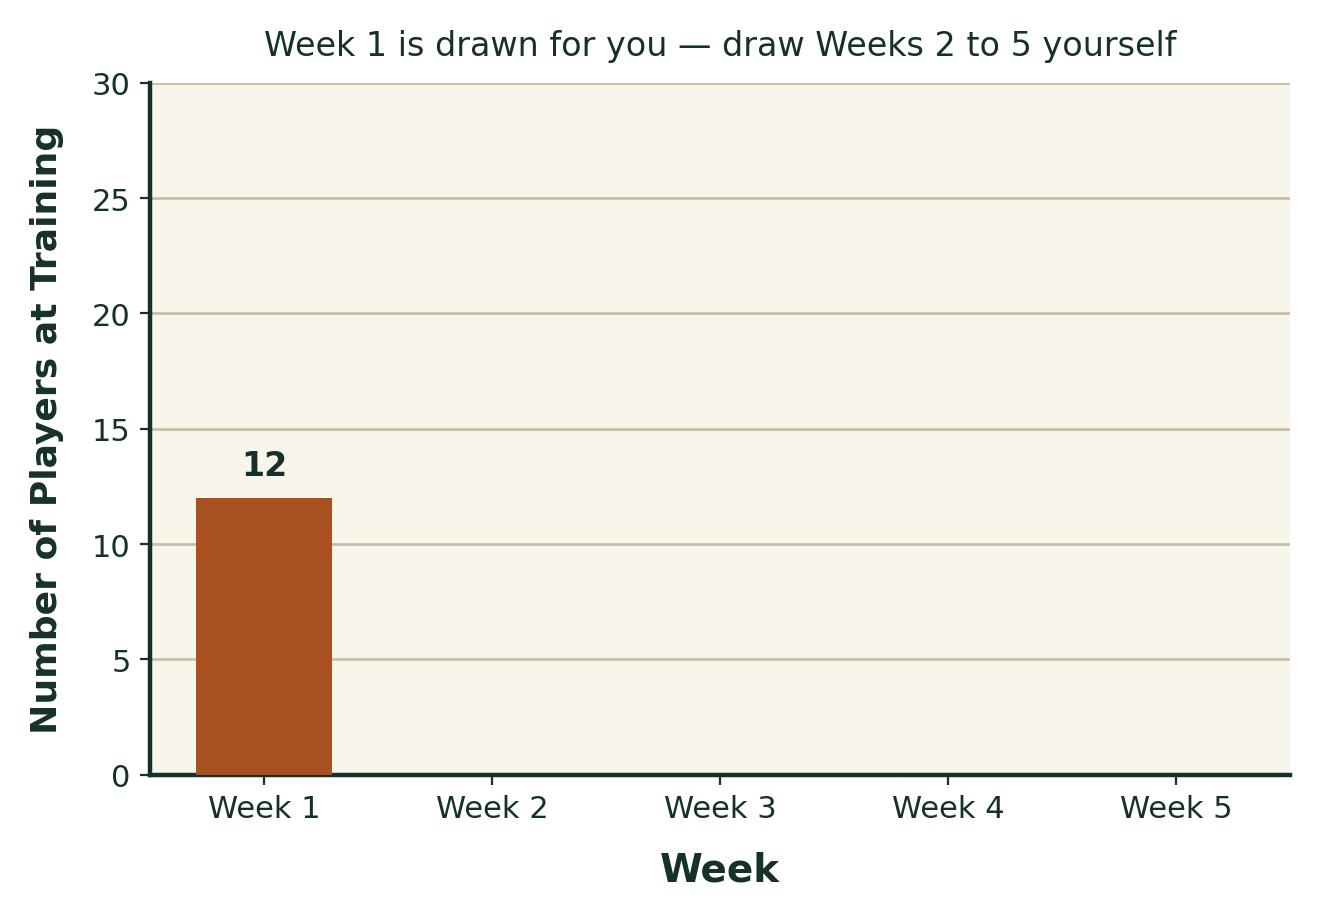
The school footy team has been trialling an extra afternoon training session. You've been asked to analyse the attendance data from the first 5 weeks and recommend whether it should continue.
We are learning to
- Represent a set of data as a bar graph.
- Calculate a simple average (mean).
- Calculate what percentage a number is of a total.
Success criteria, I can
- I can draw an accurate, labelled bar graph from a table of data.
- I can calculate the mean of a small set of numbers.
- I can use data, not just a guess, to support a recommendation.
From the worksheet
Adapting this mission to your community
- Replace footy training with whatever training or activity is most familiar (basketball, athletics, a girls' team, a cultural program).
- If real (de-identified) attendance data exists from a local team, use it instead of the example numbers.
- Involve a coach or wellbeing staff in discussing what this kind of data is actually used for.
Before you teach this
This mission uses a placeholder context. Please localise names, places, and any cultural knowledge in consultation with local Traditional Owners, Elders, or community members, and only include specific cultural knowledge that has been given permission to share.
Download this mission
The PDF is what you print. The Word file is what you edit, so you can swap in a local species, a local seasonal calendar, or local place names before the lesson.